Sign In

  • Forgot your password?
  • Need a new account?

Register


Fiber coupled FT-IR spectrometer | SIMTRUM Photonics Store

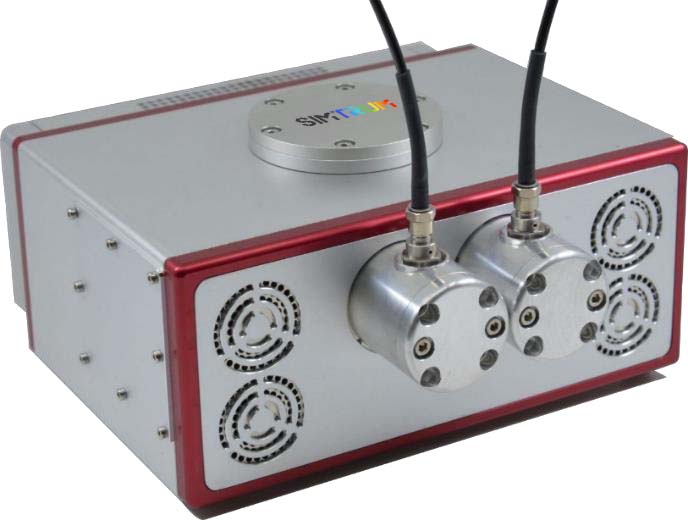
Fiber coupled FT-IR spectrometer(2000-16000nm)
SIMTRUM'S Fiber coupled FT-IR spectrometer is an all-fibered alternative. It features the same components as the FT-MIR spectrometer, with the addition of an internally mounted optical source that enables to modulate light before coupling it to the output port of the device. This architecture is thus more robust to external perturbations such as background thermal emission, as such parasitic light would not go through the interferometer before reaching the detector. Our FT-IR-FC is ideal for fibered applications with the exception of diffuse reflectance probes, which benefit from the higher throughput provided by direct feeding from a standalone source.


4-TE or Liquid-Nitrogen cooled MCT detectors available

The FTIR-FC can be equipped with both 4-stage thermo-electrically (TE) cooled or liquid-nitrogen cooled MCT detectors. The TE-cooled detectors in the FTIR-FC are the most sensitive TE-cooled detectors availabe on the market and offer a reliable and maintenance-free operation. For ultimate sensitivity levels, the FTIR-FC can also be equipped with a liquid-nitrogen cooled detector. In the NIR, the FTIR-FC can also feature an extended InGaAs detector.


Principle

Permanentely aligned interferometer

The heart of the FT-Rocket is dual corner-cube (retro-reflector) interferometer. The two corner-cubes are fixed to a common swinging arm, which rotates to create an optical path difference (with respect to the beam splitter) in the two arms of the interferometer.

This type of design is called a permanently aligned interferometer. This particular arrangement of the interfeormeter is known to be the most robust against vibrations and temperature drifts. It never has to be realigned. The swinging arm of the interferometer rotates on wear-free flexure system, making this mechanical system extremely robust and durable.


Solid-state reference laser

For measuring the movement of the mirrors, a solid-state reference laser is coupled into the interferometer. Compared to classic HeNe lasers, the solid-state lasers that we use are more compact and have a much longer life-time. They have a very low temperature-induced wavelegnth drift and, when kept at constant temperature with a Peltier element, their wavelength can be stabilized to a few PPM, thus providing a very accurate and reproducible wavelength scale. This is crucial for ensuring a day-to-day and unit-to-unit consistency.


Features

  • Internal light source
  • Ideal for operation with fibered probes
  • All-in-one solution: source, interferometer, detector and fiber-couplers
  • Most compact fiber-coupled FT-IR on the market
  • Available with TE-cooled or liquid-nitrogen cooled MCT detectors

Applications

  • Diffuse reflectance measurement
  • Optical fiber application
  • Material identification and quantification


General Parameters
Model LA-AR01-FTNIR-FC-025-2TE LA-AR01-FTMIR-FC-060-4TE LA-AR01-FTMIR-FC-085-4TE LA-AR01-FTMIR-FC-120-4TE LA-AR01-FTMIR-FC-160-LN2 LA-AR01-FTMIR-FC-160-DLA
  Beam-splitter material CaF2 ZnSe
  Spectral Range [cm-1] 11000-4000 5000-1660 6600-1200 5000-830 5000-650
  Spectral Range [μm] 0.9-2.5 2-6 1.5-8.5 2-12 2-16
  Detector Type InGaAs(2-TE cooled) MCT (4-TE cooled) MCT (LN2 cooled) DLATGS
  Detector Peak D*[cm Hz1/2 W-1] >2×10^11 >1×10^11 >8×10^9 >4×10^9 >5×10^10 >2.5×10^10
  Signal-to-noise ratio >100000:1 >80000:1 >40000:1 >40000:1 >70000:1 >8000:1
  Recommended fiber multimode silica fiber IFG (1-6μm) IFG (1-6μm)orPIR (3-18μm) PIR (3-18μm)
  Internal reference laser @975nm Temperature-stabilized, @850nm
  Power requirement 40W @12VDC 30W @12VDC
  Integrated light source 20W QTH bulb(285°K) 20W SiC globar(1550°K)
  Resolution(unapodized) [cm-1] 2, 4, 8 (user selectable)
  Wavenumber repeatability <10 PPM
  Scan frequency >4 Hz @ 4cm^-1
 
Other Parameters
  Fibered interface Fiber core up to ∅ 900μm, NA=0.3, SMA 905 connector
  Interferometer type Permanently aligned, double retro-reflector design
  A/D Converter 24 bit
  Operating temperature 10℃-40℃
  Communication Interface USB 2.0
  Software Interface Windows 7/10 API for controlling the instrument via our DLL
  Dimensions 180mm×160mm×80mm
  Weight 2200g (excluding LN2 dewar)

FT-IR spectroscopy: high resolution measurements

Introduction

Fourier Transform infrared (FT-IR) spectrometers have proven to be efficient and reliable tools for a large variety of applications targeting the near infrared (NIR) and mid-infrared (MIR) regions of the electromagnetic spectrum. One of the most critical specification of FT-IR spectrometers is their spectral resolution , as this defines the scale of the features to be distinguished e.g. in the absorbance spectrum of a gas. It is thus quite natural to wish for the highest achievable resolution when purchasing an FT-IR spectrometer. Due to their operational mode, achieving high resolution measurements using FT-IR spectrometers is however not entirely straightforward. This technical note explains the main limits of high resolution FT-IR measurements.


Fig .1 Simplified FT-IR setup


A simplified FT-IR is depicted in Fig.1. It consists of a beamsplitter, a fixed mirror and a movable mirror. Light from a purely monochromatic light source is split in two beams, assumedly in equal parts (50% beamsplitter). Each beam bounces back on either mirror (fixed or movable) before being recombined and focused onto the detector. When the movable mirror is at the same distance from the beamsplitter as the fixed mirror, both beams travel the same distance and recombine in-phase, yielding constructive interference. By displacing the moving mirror by a distance ℓ, one introduces an optical path difference (OPD) between the two beams Δ given by:Δ=2ℓ.

Upon recombination at the detector, the optical intensity as a function of OPD is given by: I(0)=0.5I0[1+cos(2πν0∆)]=IDC+IAC(∆).

Where I0 is the source intensity at wavenumber ν0 (the wavenumber is the reciprocal of the wavelength). The AC part of the interference record is labelled IAC(Δ) and is called the interferogram. For a purely monochromatic source (as considered here), the interferogram is a pure cosine function.


Fig 2. Interferogram of a purely monochromatic light source


Here the wavenumber (or equivalently the wavelength) of the source as well as its intensity can be retrieved from a direct observation of the interferogram (amplitude and period of the cosine function). For a broadband source, the interferogram IAC(Δ) and spectrum I0(ν) of the source are related via a Fourier transform operation:

I0(v)=∫∆maxIAC(∆)cos(2πν0∆)d∆

Obviously, the OPD cannot be made arbitrarily large and has to reach a value Δmax that is defined by technological design. Given the nature of the relationship between the interferogram and the spectrum (Fourier transform), it turns out that Δmax also defines the achievable spectral resolution. To a first approximation, the spectral resolution Δν of an FT-IR is given by:

∆ν=(∆max)-1

and is often expressed in cm-1. So why not simply increase the maximum OPD to enhance the spatial resolution of an instrument ? While this is true, special care has to be considered when operating at high resolution. As explained hereafter, the mirror maximum displacement is limited by the divergence of the system and the dimensions of the detector.


HR measurement: effect of beam divergence

We consider the exact same setup as in Fig.1. The beam divergence is accounted for by observing the behavior of the so called "extreme ray", which makes an angle α with respect to the "central ray" discussed previously.


Fig 3. FT-IR setup with a divergent source


The two extreme rays (reflected from either the fixed or the moving mirror) hit the lens with an angle α, unlike the central ray which hits the lens at normal incidence. They are thus focused on another point on the detector. Moreover, their OPD is shorter than for the central ray:

ext=2ℓcos(α)

The larger the angle α, the greater the difference with the central ray OPD Δcen=2ℓ. Consider now the case where the difference in OPD between the central ray and the extreme ray is equal to one half of the source wavelength, that is:

cen-∆ext=2ℓ[1-cos(α)]=λ/2

In this scenario, when the central rays are in phase, then the extreme rays are out of phase (and vice versa). Consequently, the intensity over the detector surface follows the profile shown in Fig. 4.


Fig 4. Intensity over the detector surface due to a highly diverging beam


Since the detector yields a single value that corresponds to the average intensity received on its surface, the signal detected in this case corresponds to the average optical intensity only, and all information regarding the interference signal vanishes. Practically speaking, the interferogram will start losing contrast as the moving mirror is scanned as shown in Fig. 5.


Fig 5. Loss in interferogram contrast due to a diverging beam


This effect is naturally existing in all interferometers based instruments (such as FT-IR) and cannot be avoided. It can however be properly managed by appropriately trading-off the parameters involved in equation (6), namely :

  • Δν: the effect is more pronounced for high resolution measurements due to the larger OPD required.
  • α: the effect is more pronounced for a highly diverging beam.
  • λ: the effect is more pronounced at short wavelengths (large wavenumbers).


For most applications in solids and liquids, the size of the observable features is typically broader than 2cm-1, and high resolution (HR) measurements performed at 0.5cm-1 are usually not required. In addition, these would prove challenging due to the added contrast loss described in this document. HR measurements might still be a viable option for specific applications, such as e.g. laser characterization, where the highly collimated laser beam prevents the dramatic loss of the interferogram contrast.


We fully appreciate and value the multiple benefits that a dedicated, performant and reliable software can bring to your application. Automatic data collection, parameters changes, status diagnosis and many other essential tasks should be implemented as simply and as efficiently as possible in order to get the most out of your spectrometer. This philosophy led to the development of a multi-threading, cross-platform and versatile software application, the digital acquisition system or AoDAQ.

The AoDAQ simultaneously takes care of:

1. Handling communication with the FT-IR via USB

2. Processing raw signals to deliver a spectrum

3. Running a TCP Ethernet server

The AoDAQ can be installed on all sorts of computers, from desktop machines to embedded, low-power single board computers. Thanks to the hosting of a TCP server, the instrument data and parameters can be accessed locally and/or remotely. All communication with the instrument eventually reduces to a set of TCP/IP commands that allow to quickly acquire data, adjust parameters, monitor the instrument status etc. using the programming environment of your choice. 


1.What resolution should I use for my application?

In FTIR, resolution is traded-off with two other experimental metrics that are acquisition time and signal-to-noise ratio (SNR). Increasing resolution, meaning reducing the resolution parameter number, will result in longer acquisition time, and poorer SNR. In general, it is recommended to work at the "worst" possible resolution, that is the limit resolution that allows to distinguish the features of the sample or substance that you are characterizing. Liquids and solids present broader features than gases or gas mixtures and can generally be probed with standard resolution instruments (down to 2cm-1). Gas analysis or light sources characterization (typically lasers) usually benefit from a sharper resolution of 0.5cm-1.


2.How is the equivalent wavelength resolution calculated?

Due to its working principle, FT-IR provides uniformly sampled spectra in the form of wavenumber (ν) within a given spectral range, with the unit of cm-1. Wavenumber is simply defined as the reciprocal of wavelength (λ). The resolution of a FT-IR is a constant wavenumber (Δν), but varies with the wavelength (Δ λ) due to the inverse relationship between these two units. The conversion between wavenumbers resolution and wavelengths resolution is Δλ=λ2 · Δν, as shown in the following figure:


3.What is the acquisition rate of this spectrometer?

The acquisition rate varies with the resolution. At the standard resolution of (4cm-1), the scanning rate is ~5Hz, and at the high resolution of (0.5cm-1), the scanning rate is ~1Hz, that is, the scanning rate is inversely proportional to the resolution.


4.What are the differences between DLADTGS detectors and MCT detectors?

DLADTGS is based on the pyroelectric effect. When exposed to infrared radiation, its temperature will change, causing the polarization inside the crystal to change. MCT is a bandgap type photoconductive detector. DLADTGS has a wider spectral response range (up to 18-20 μm), and MCT detectors utilize thermoelectric cooling to achieve higher sensitivity, which can suppress dark current and improve their signal-to-noise ratio.


5.How much better is the performance of LN4 cooled detectors than that of MCT cooled detectors?

The SNR of the LN4 cooling system is approximately ten times that of the MCT cooling system.


6.Why is the performance of the Fourier transform spectrometer superior to that of the dispersive grating spectrometer?

The performance of a grating spectrometer mainly depends on the slit and detector. Due to the different dark noise of each pixel point, additional noise will be introduced during measurement. FTIR spectrometers are generally superior to dispersive grating spectrometers due to their higher light throughput, better signal-to-noise ratio, higher spectral resolution and wider wavelength range. These advantages make FTIR spectrometers the preferred choice in many applications, especially in places where high sensitivity and accuracy are required.


7.Can an FTIR spectrometer be used to measure pulsed laser?

Sure, but the power of the laser must be limited to avoid irreversible damage to the detector. The average power shall not exceed 25mW, and the peak power of pulses shorter than 1µs shall not exceed 100W. It is recommended to use a set of fixed or variable attenuators to adjust the optical power to avoid detector saturation. Secondly, the repetition frequency of the laser must exceed 25khz to avoid numerical artifacts (aliasing) in the measured spectrum.


8.Can the concentration of the substance being measured be obtained directly?

No. A spectrometer can only provide the measured spectrum. Users must obtain the concentration of substances in the sample through specific algorithms and calibration data.


9.Can this spectrometer be used for mineral identification?

The FT-NIR spectrometer is highly suitable for mineral identification. FT-NIR is capable of generating high-quality and high-resolution (better than 1nm) reflection spectra within the spectral range of 900-2550nm (SWIR) within a few seconds.


Related products

Model Wavelength Range Resolution Detector  
  FT-NIR spectrometer 900-2500 nm 2/4/8 cm-1(user selectable) Extended type InGaAs PIN photodiode, 2TE cooled
  FT-MIR spectrometer 200-16000 nm 0.5/2/4/8cm-1(user selectable) MCT (4-TE cooled)
MCT (LN2 cooled)
DLATGS
  Fiber coupled FT-IR spectrometer 200-16000 nm 2/4/ 8cm-1 (user selectable) InGaAs (2-TE cooled)
MCT (4-TE cooled)
MCT (LN2 cooled)
  VIS-NIR-FIB spectrometer 350-2500 nm <1.5 nm silicon array detector (3648 pixels) 16-bit ADC.extended range InGaAs photodiode, 2TE cooled, 24-bit ADC.
  VIS-NIR-DR spectrometer 360-2500 nm 5 nm Extended range InGaAs detector

We are here for you!


Drop us an email at info@simtrum.com to get the Best Price today.   Want more technical information? Click Here for the professional Customized System/ Solutions.


Don't have time to search the products one by one? No worries. you can download the full range of SIMTRUM Product Line Cards.

Click it now.


Want to stay closer to the Market Dynamics and Technological

Developments? Just take 5 seconds to Sign In as a member of 

SIMTRUM, we will bring you the most up-to-date news. 

(Sign in button on the top right of the screen).


Search Reset
Compare Model Drawings & Specs Availability Reference Price
(USD)
LA-AR01-FTNIR-FC-025-2TE
Spectral Range:0.9-2.5μm,Detector Peak D*:>2×10^11cm Hz^1/2 W^-1,Signal-to-noise ratio:>100000:1,Detector Type:InGaAs(2-TE cooled),Resolution :2/4/ 8cm-1 (user selectable)
4-6week $27018.00
LA-AR01-FTMIR-FC-060-4TE
Spectral Range:2-6μm,Detector Peak D*:>1×10^11cm Hz^1/2 W^-1,Signal-to-noise ratio:>80000:1,Detector Type:MCT(4-TE cooled),Resolution :2/4/ 8cm-1 (user selectable)
4-6week $27520.00
LA-AR01-FTMIR-FC-085-4TE
Spectral Range:1.5-8.5μm,Detector Peak D*:>8×10^9cm Hz^1/2 W^-1,Signal-to-noise ratio:>40000:1,Detector Type:MCT(4-TE cooled),Resolution :2/4/ 8cm-1 (user selectable)
4-6week $27520.00
LA-AR01-FTMIR-FC-120-4TE
Spectral Range:2-12μm,Detector Peak D*:>4×10^9cm Hz^1/2 W^-1,Signal-to-noise ratio:>40000:1,Detector Type:MCT(4-TE cooled),Resolution :2/4/ 8cm-1 (user selectable)
4-6week $27520.00
LA-AR01-FTMIR-FC-160-LN2
Spectral Range:2-16μm,Detector Peak D*:>5×10^10cm Hz^1/2 W^-1,Signal-to-noise ratio:>70000:1,Detector Type:MCT(LN2 cooled),Resolution :2/4/ 8cm-1 (user selectable)
4-6week $30080.00
LA-AR01-FTMIR-FC-160-DLA
Spectral Range:2-16μm,Detector Peak D*:>2.5×10^8cm Hz^1/2 W^-1,Signal-to-noise ratio:>8000:1,Detector Type:DLATGS,Resolution :2/4/ 8cm-1 (user selectable)
4-6week $27520.00

LA-AR01-FTMIR-FC-160-DLA - Parameter

LA-AR01-FTMIR-FC-160-LN2 - Parameter

LA-AR01-FTMIR-FC-120-4TE - Parameter

LA-AR01-FTMIR-FC-085-4TE - Parameter

LA-AR01-FTMIR-FC-060-4TE - Parameter

LA-AR01-FTNIR-FC-025-2TE - Parameter

LA-AR01-FTMIR-FC-160-DLA - Download

LA-AR01-FTMIR-FC-160-LN2 - Download

LA-AR01-FTMIR-FC-120-4TE - Download

LA-AR01-FTMIR-FC-085-4TE - Download

LA-AR01-FTMIR-FC-060-4TE - Download

LA-AR01-FTNIR-FC-025-2TE - Download

Accessories

Compare Model Drawings & Specs Availability Reference Price
(USD)