+Hyperspectral Imaging +PCA Plot
Background
Hyperspectral Imaging produces a wealth of information when used in surveillance, quality checks and sample studies. When adopted with a range of statistical processes, the spectral information collected can assist with sorting, identifcation or remote monitoring.
Introduction
Hyperspectral Imaging involves the process of collecting both spatial and spectral information of each frame. Suitable for lab based sample study or Industrial Processes in remote monitoring: the spatial information would correspond with the sample, location or objects being studied or monitored. Simultaneously, spectral information is collected through the electromagnetic radiation being emitted or reflected by the sample subject. As a camera is being used - any camera with a sufficient high frame rate can quickly capture this information for either remote or later processing. Using statistical processes like PCA plotting - large data samples can be generated to quantify the samples being studied.
Application
The spectral information yielded in such a process can be catagorised by the spectral window of information being recorded. Traditional spectral windows correspond to visible (400 to 1000nm), near-infrared (950 to 2200nm), and mid-infrared (2900 to 4200nm). The subject or application being used for the hyperspectral imaging information would then corespond to the wavelength window being used.
Statistical Analysis: Principle Component Analysis (PCA ) Plots.
PCA plots have two axes - Component 1 and Component 2. Component 1 and 2 have properties dictated by a loading plot which consists of factors that contribute to the properties that component 1 or 2 are made off. In the context of hyperspectral imaging, the two largest contributing factors to the loading plot are the spatial information, and spectral information.
Agricultural Surveilance Hyperspectral Imaging
Red Eye HSI Camera (950nm to 1700nm)
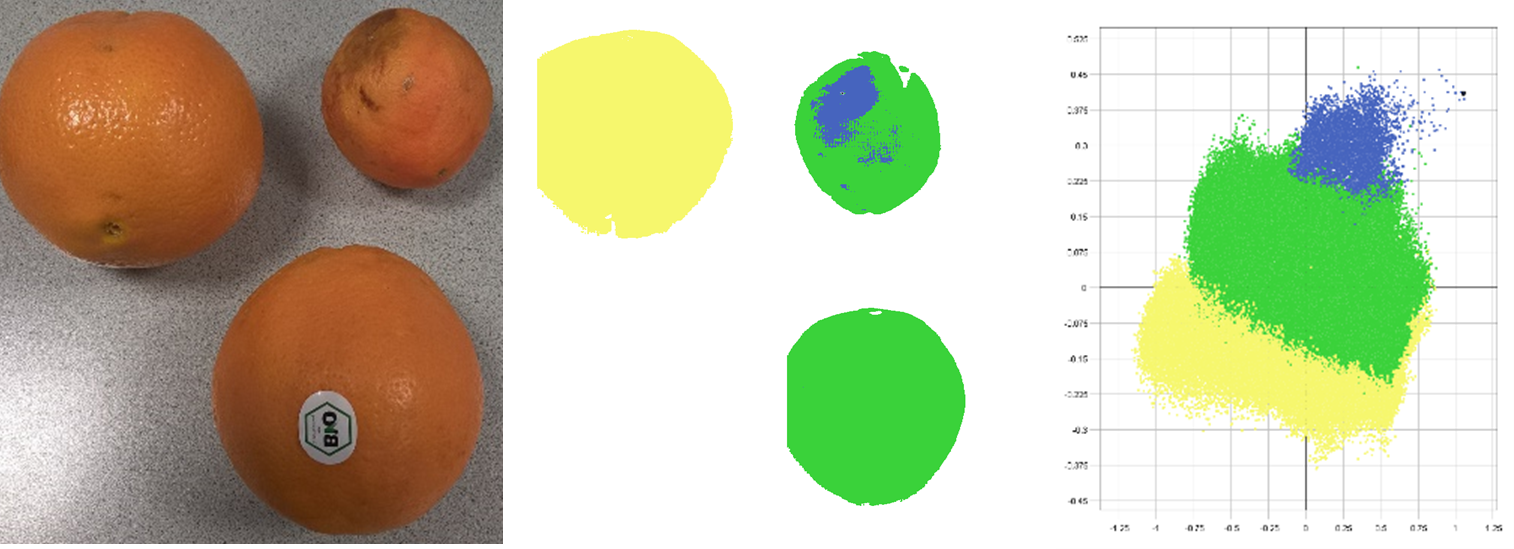
Left: Standard pictures of Oranges, Middle: Image classified by spectral information, Right: PCA plot of categories for oranges. Blue: Bruised area on orange. Green: Organic orange surface. Yellow: Non-organic material (chemical spray, pesticides etc).
Industrial applications for agricultural samples allow for the identifcation of healthy products, organic products and the amount of pesticides used. Hyperspectral imaging and plotting the information on a PCA graph allows for clear distinction for the different kinds of ranges being studied. Scaled up, this process can be adopted for crop monitoring or quality checking, replacing older or more manual labour oriented processes.
Due to the structured breakdown of the data, further statistical applications can be adopted for processes like machine learning, data analysis and more.
Learn More about Hyperspectral Imaging Cameras
Arrange a Call Back
Contact us at info@simtrum.com to arrange a call back: Get technical support, integration assessment or purchasing information.